
Data Visualization
What kind of nerd has two thumbs and data as a hobby? This one right here. Sometimes I get curious and whip up a spreadsheet to analyze trends and patterns. I might need more friends.
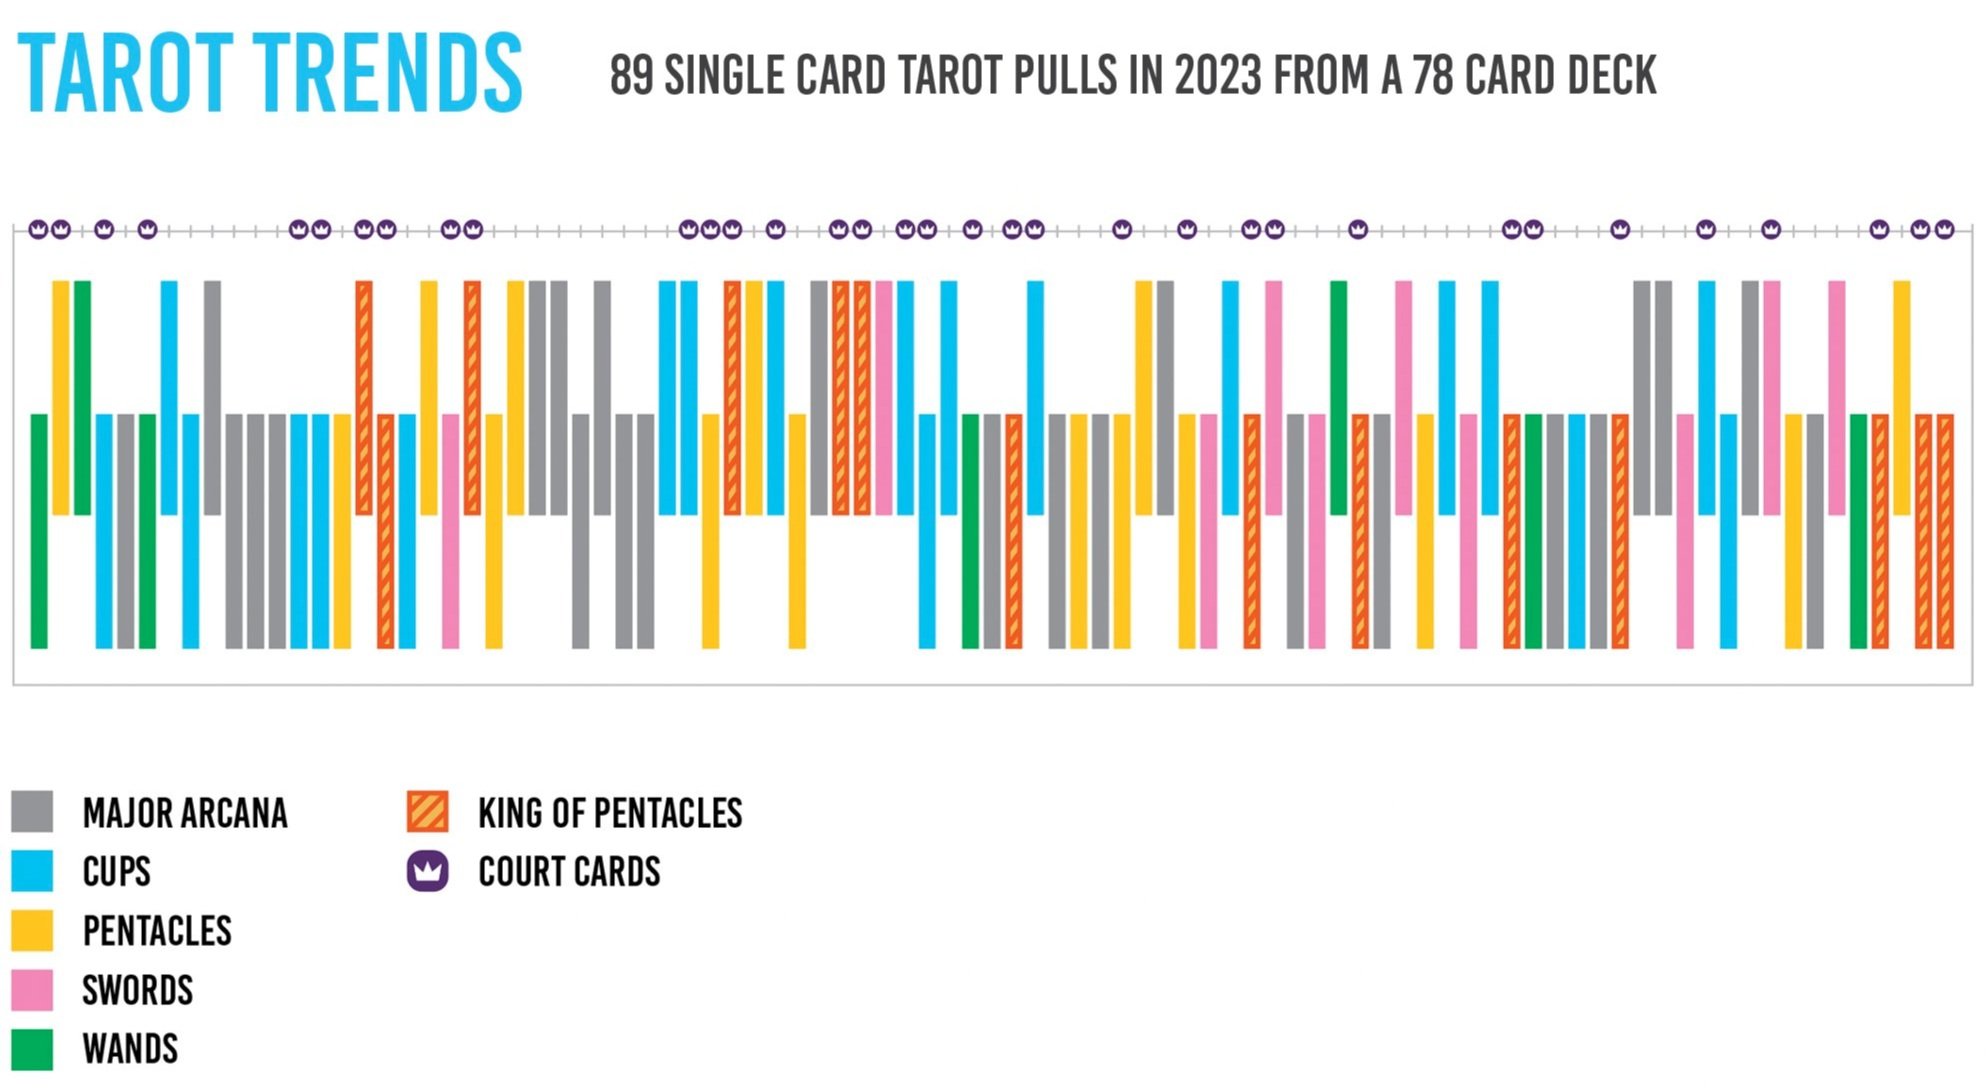
Tarot Trends
In 2023, I tracked my 89 single tarot card pulls. Higher bars represent upright cards, lower bars represent reversed cards.
Notable data point: Out of 89 pulls, I pulled the King of Pentacles 14 times. The likelihood of that happening is 0.0000000009204%.
Spending While Sad
I took a look at one year of my purchase history to see if my shopping habits were influenced by bad moods.
Notable data point: On average, my spending total increases by 24.7% the week before my period.

Hobby Hierarchy
Aligned my excessive interest in hobbies with my top core values to gauge where I should be prioritizing my time.
